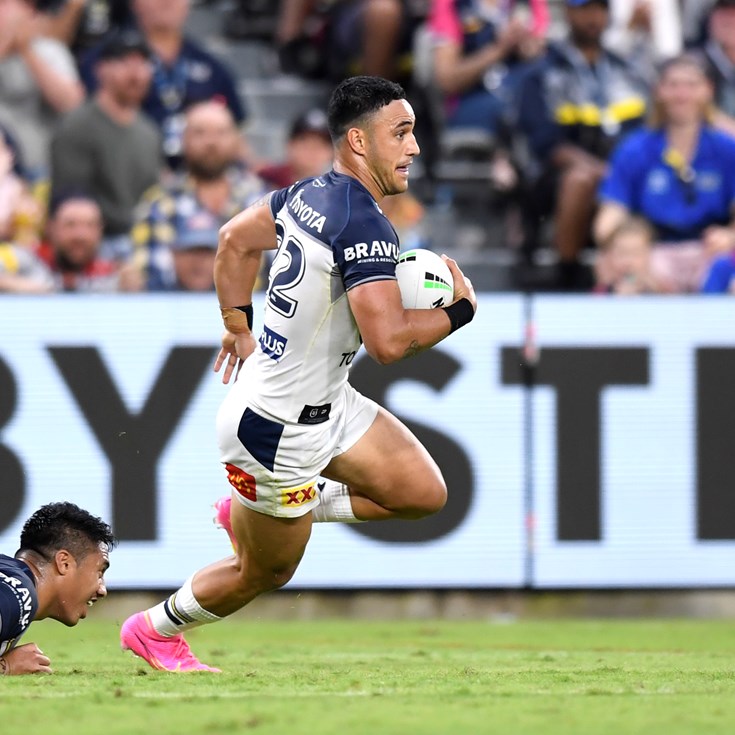
Valentine Holmes
Centre
Player Bio
- Height:
- 185 cm
- Date of Birth:
- 24 July 1995
- Weight:
- 90 kg
- Birthplace:
- Townsville, QLD
- Age:
- 29
- Nickname:
- Val
- Debut Club:
- Cronulla-Sutherland Sharks
- Date:
- 02 August 2014
- Opposition:
- Parramatta Eels
- Round:
- 21
- Previous Club:
- Cronulla-Sutherland Sharks
- Junior Club:
- Western Lions
- Biography:
Bio brought to you by Cowboys Leagues Club
Cowboys member number: 501502-----------------------------------------------------------------
The 27-year-old played 105 NRL games across five seasons for the Cronulla Sharks between 2014 and 2018.
Holmes was a crucial member of the Sharks’ maiden premiership-winning outfit in 2016, scoring 19 tries in 26 games.
Playing the majority of his games at fullback, Holmes scored a remarkable 22 tries in just 26 games in 2018 and led the NRL with 26 line-breaks. He also claimed the 2018 Sharks’ Player of the Year and Player’s Player awards.
In total, Holmes crossed for 66 tries in his 105 NRL appearances and also booted 51 goals from 69 attempts at a 74 per cent success rate.
In 2022, Holmes finished at the top of the NRL's point scorers list with 244 points, setting a club record in the process.
Holmes is contracted until the end of the 2025 season.
-----------------------------------------------------------------
Who is your celebrity lookalike: Jalen Hurts
If you could swap jobs with anyone in the world, who would it be: Morgan Wallen
Least favourite household chore: Watering plants
One thing you’d like to learn how to do: Hit low draws
One thing that you really dislike: Taxes
Favourite holiday destination: Queenstown
What would your ultimate golf grouping be: Drake, Lebron James, Tiger Woods
Career
- Appearances
- 203
- Tries
- 108
2024 Season
- Appearances
- 24
Scoring
- Tries
- 16
- Goals
- 101
Kicking
- Goal Conversion Rate
-
Attack
- Try Assists
- 10
- Line Breaks
- 18
- Tackle Breaks
- 92
Passing
- Receipts
- 489
Defence
- Tackles Made
- 230
- Missed Tackles
- 55
- Tackle Efficiency
-
Running Metres
- Average Running Metres
- 152
- Total Running Metres
- 3657
Fantasy
- Total Points
- 1175
- Average Points
- 49
2024 Season - By Round
| Round | Opponent | Score | Position | Minutes Played | Tries | Goals | 1 Point Field Goals | 2 Point Field Goals | Points | Kicking Metres | Forced Drop Outs | Try Assists | Linebreaks | Tackle Breaks | Post Contact Metres | Offloads | Receipts | Tackles Made | Missed Tackles | Total Running Metres | Hit Up Running Metres | Kick Return Metres | |
|---|---|---|---|---|---|---|---|---|---|---|---|---|---|---|---|---|---|---|---|---|---|---|---|
| 1 | Dolphins | Won | 18 - 43 | Centre | 80 | - | 7 | - | - | 14 | - | - | 1 | - | 4 | 73 | 3 | 22 | 11 | 1 | 180 | 37 | - |
| 2 | Knights | Won | 21 - 20 | Centre | 82 | - | 2 | - | - | 4 | 12 | - | 1 | - | 3 | 52 | 1 | 21 | 15 | 2 | 123 | - | - |
| 3 | Dragons | Won | 24 - 46 | Centre | 80 | 1 | 7 | - | - | 18 | - | - | 1 | 2 | 7 | 108 | 1 | 20 | 13 | 2 | 247 | 11 | - |
| 4 | Broncos | Lost | 38 - 12 | Centre | 80 | 1 | 2 | - | - | 8 | 15 | 1 | - | - | 4 | 37 | 2 | 20 | 10 | 2 | 114 | - | - |
| 5 | Titans | Won | 35 - 22 | Centre | 80 | - | 5 | - | - | 10 | 35 | - | 1 | 1 | 4 | 54 | 2 | 26 | 10 | 2 | 216 | 18 | 14 |
| 6 | Eels | Lost | 27 - 20 | Centre | 80 | 1 | 2 | - | - | 8 | - | - | - | 2 | 4 | 27 | 1 | 16 | 6 | 1 | 104 | - | 2 |
| 7 | Sharks | Lost | 42 - 6 | Centre | 80 | 1 | 1 | - | - | 6 | - | - | - | - | 2 | 30 | - | 19 | 15 | 2 | 111 | - | - |
| 8 | Panthers | Lost | 20 - 26 | Centre | 80 | 1 | 2 | - | - | 8 | - | - | - | 1 | 6 | 41 | 2 | 21 | 5 | 2 | 147 | - | - |
| 9 | Dolphins | Lost | 26 - 28 | Centre | 80 | - | 3 | - | - | 6 | - | - | - | 1 | 4 | 60 | - | 17 | 7 | 5 | 191 | - | - |
| 10 | Titans | Lost | 20 - 18 | Centre | 80 | - | 2 | - | - | 4 | - | - | - | 1 | 3 | 77 | - | 28 | 11 | - | 201 | - | - |
| 11 | Rabbitohs | Won | 22 - 28 | Centre | 80 | - | 4 | - | - | 8 | 33 | - | - | - | 4 | 49 | 1 | 22 | 14 | 4 | 117 | 14 | - |
| 12 | Wests Tigers | Won | 42 - 28 | Centre | 70 | 2 | 7 | - | - | 22 | - | - | - | 4 | 6 | 56 | - | 18 | 7 | - | 220 | - | - |
| 14 | Warriors | Lost | 12 - 42 | Centre | 80 | - | 2 | - | - | 4 | - | - | 1 | - | 2 | 38 | - | 17 | 9 | 4 | 116 | 5 | - |
| 15 | Raiders | Won | 16 - 34 | Centre | 80 | 1 | 5 | - | - | 14 | - | - | - | - | 4 | 50 | - | 22 | 11 | 2 | 151 | - | - |
| 18 | Sea Eagles | Lost | 20 - 21 | Centre | 84 | - | 3 | - | - | 6 | - | - | - | - | 3 | 46 | 1 | 18 | 11 | 6 | 132 | - | 5 |
| 20 | Bulldogs | Won | 20 - 18 | Centre | 80 | - | 4 | - | - | 8 | - | - | - | - | 4 | 54 | - | 15 | 5 | - | 129 | - | - |
| 21 | Sharks | Won | 30 - 22 | Centre | 80 | - | 5 | - | - | 10 | 12 | - | 1 | 1 | 4 | 33 | - | 21 | 15 | 3 | 127 | - | - |
| 22 | Wests Tigers | Won | 30 - 48 | Centre | 80 | 1 | 7 | - | - | 18 | - | - | 2 | 2 | 4 | 41 | - | 21 | 4 | 3 | 171 | - | - |
| 23 | Broncos | Lost | 18 - 42 | Centre | 80 | - | 3 | - | - | 6 | - | - | - | - | 4 | 52 | - | 22 | 10 | 5 | 171 | 17 | 15 |
| 24 | Raiders | Won | 42 - 4 | Centre | 80 | 3 | 7 | - | - | 26 | - | - | - | 1 | 2 | 50 | 1 | 24 | 10 | 1 | 176 | - | - |
| 26 | Storm | Won | 38 - 30 | Centre | 80 | 1 | 7 | - | - | 18 | - | - | 1 | - | 1 | 22 | - | 19 | 7 | 3 | 80 | - | - |
| 27 | Bulldogs | Won | 6 - 44 | Centre | 80 | 1 | 8 | - | - | 20 | 14 | - | - | - | 4 | 36 | - | 19 | 8 | 2 | 128 | - | 6 |
| 28 | Knights | Won | 28 - 16 | Centre | 80 | - | 4 | - | - | 8 | 35 | - | 1 | - | 1 | 45 | - | 21 | 10 | 2 | 138 | - | - |
| 29 | Sharks | Lost | 26 - 18 | Centre | 77 | 2 | 2 | - | - | 12 | - | - | - | 2 | 8 | 34 | - | 20 | 6 | 1 | 156 | - | - |
Career By Season
| Year | Played | Won | Lost | Drawn | Win % | Tries | Goals | 1 Point Field Goals | 2 Point Field Goals | Points | Kicking Metres | Kicking Metres Average | Goal Conversion Rate | Forced Drop Outs | Try Assists | Linebreaks | Receipts | Tackles Made | Missed Tackles | Tackle Efficiency | Total Running Metres | Average Running Metres | Kick Return Metres | Total Points | Average Points | |
|---|---|---|---|---|---|---|---|---|---|---|---|---|---|---|---|---|---|---|---|---|---|---|---|---|---|---|
| Sharks | 2014 | 6 | - | 6 | - | - | 3 | - | - | - | 12 | - | - | - | - | 1 | 4 | 103 | 22 | 4 | 72.78% | 721 | 120.00 | 169 | 131 | 21.8 |
| Sharks | 2015 | 25 | 15 | 10 | - | 60% | 16 | 11 | - | - | 89 | 272 | 10.88 | 84.62% | 1 | 1 | 15 | 372 | 75 | 23 | 76.53% | 3,054 | 122.00 | 1,013 | 729 | 29.2 |
| Sharks | 2016 | 26 | 19 | 6 | 1 | 73% | 19 | 2 | - | - | 80 | 151 | 5.79 | 28.57% | - | 2 | 21 | 382 | 94 | 20 | 75.42% | 3,372 | 129.00 | 737 | 782 | 30.1 |
| Sharks | 2017 | 22 | 13 | 9 | - | 59% | 6 | 10 | - | - | 44 | 112 | 5.09 | 83.33% | 2 | 5 | 10 | 528 | 71 | 31 | 69.61% | 3,678 | 167.00 | 1,778 | 751 | 34.1 |
| Sharks | 2018 | 26 | 17 | 9 | - | 65% | 22 | 28 | - | - | 144 | 143 | 5.49 | 75.68% | 2 | 8 | 26 | 696 | 94 | 39 | 70.68% | 3,999 | 153.00 | 1,545 | 1,084 | 41.7 |
| Cowboys | 2020 | 12 | 4 | 8 | - | 33% | 4 | 24 | 1 | - | 65 | 109 | 9.06 | 70.59% | - | 9 | 6 | 369 | 52 | 15 | 77.61% | 1,457 | 121.00 | 541 | 445 | 37.1 |
| Cowboys | 2021 | 20 | 7 | 13 | - | 35% | 4 | 54 | 2 | - | 126 | 134 | 6.72 | 72.97% | 1 | 10 | 8 | 681 | 96 | 43 | 69.06% | 3,476 | 173.00 | 1,306 | 839 | 42.0 |
| Cowboys | 2022 | 24 | 17 | 7 | - | 71% | 10 | 100 | 2 | 1 | 244 | 57 | 2.38 | 81.97% | - | 5 | 12 | 478 | 169 | 50 | 77.17% | 3,519 | 146.00 | 63 | 1,066 | 44.4 |
| Cowboys | 2023 | 18 | 10 | 8 | - | 56% | 8 | 68 | - | 1 | 170 | 55 | 3.04 | 82.93% | 1 | 6 | 11 | 357 | 140 | 39 | 78.21% | 3,053 | 169.00 | 96 | 835 | 46.4 |
| Cowboys | 2024 | 24 | 14 | 10 | - | 58% | 16 | 101 | - | - | 266 | 157 | 6.55 | 84.87% | 1 | 10 | 18 | 489 | 230 | 55 | 80.70% | 3,657 | 152.00 | 44 | 1,175 | 49.0 |
Career Overall
| Year Start | Year End | Played | Won | Lost | Drawn | Win % | Tries | Goals | 1 Point Field Goals | 2 Point Field Goals | Points | Kicking Metres | Kicking Metres Average | Goal Conversion Rate | Forced Drop Outs | Try Assists | Linebreaks | Receipts | Tackles Made | Missed Tackles | Tackle Efficiency | Total Running Metres | Average Running Metres | Kick Return Metres | Total Points | Average Points | |
|---|---|---|---|---|---|---|---|---|---|---|---|---|---|---|---|---|---|---|---|---|---|---|---|---|---|---|---|
| Sharks | 2014 | 2018 | 105 | 64 | 40 | 1 | 61% | 66 | 51 | - | - | 369 | 677 | 6.45 | 73.91% | 5 | 17 | 76 | 2,081 | 356 | 117 | 75.26% | 14,825 | 141.00 | 5,244 | 3,478 | 33.1 |
| Cowboys | 2020 | 2024 | 98 | 52 | 46 | - | 53% | 42 | 347 | 5 | 2 | 871 | 512 | 5.22 | 80.51% | 3 | 40 | 55 | 2,371 | 687 | 202 | 77.28% | 15,147 | 154.00 | 2,045 | 4,357 | 44.5 |
Latest


Team Mates


North Queensland Cowboys respect and honour the Traditional Custodians of the land and pay our respects to their Elders past, present and future. We acknowledge the stories, traditions and living cultures of Aboriginal and Torres Strait Islander peoples on the lands we meet, gather and play on.